cdkbook
Cheminformatics
*Note: this chapter is an evolved version of a chapter of my PhD thesis [1]. *
While the purpose of this book is not to educate in cheminformatics (see Chapter 1), this chapter provides minimal information about the representation of molecules and molecular systems. Such a representation is needed to allow analysis and manipulation of chemical structures in the computer. This is of paramount importance in areas like drug design, synthesis planning, property prediction, crystal structure engineering, structure elucidation, searching in chemical literature, exchange of chemical knowledge, and structure elucidation.
Many different representations have been developed, each capturing different bits of information about the molecular system under study. Unfortunately, in many cases it is unclear which part of the information is essential for a certain application. For example, although the boiling points correlates well with the number of carbon atoms in a homologous series of alkanes [2] (see Figure 3.1), the carbon count descriptor is not generally useful for predicting other properties, or even the same property for a more diverse set of molecules. From simple physico-chemical principles, it is clear why this is the case.
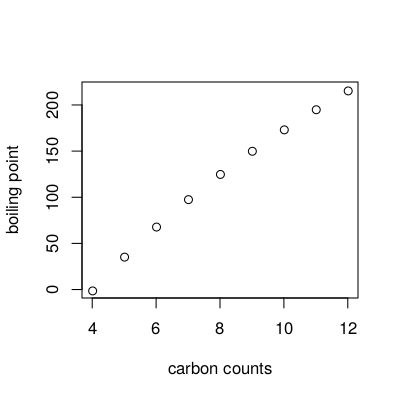
Figure 3.1: Diagram showing the relation between the boiling point and the numberof carbon atoms in alkanes.
However, for more complex problems there is very little a-priori knowledge that guides us in choosing appropriate descriptors. Nevertheless, in certain areas specific habits have evolved; for example, a large part of the quantitative structure-activity and structure-property relationship (QSAR and QSPR) community routinely calculates hundreds or thousands of simple molecular descriptors, and uses various variable-selection techniques to extract the most useful ones. Unfortunately, validation of this process is almost impossible due to the small size of data sets. It would a giant leap forward if we could say beforehand, based on the characteristics of the molecular system and our aim, what descriptors would be most informative. This is currently, however, still too far-fetched. Therefore, we are forced to judge the quality of the representation on the basis on the quality of the prediction: if we are able to correctly predict properties of new compounds, then we conclude that the representations contains relevant information.
This chapter describes the role of representation in modeling properties of molecular systems of organic molecules and in the exchange of molecular information. The following paragraphs give an overview on useful representations.
Molecular Representations
The two most common methods to represent organic molecules are the (systematic) name and the 2D drawing of the molecule. They identify the molecule of interest, but cannot be used for machine processing. To prevent ambiguities, conventions describing how molecules should be named and drawn are needed. IUPAC name recommendations, and line notations such as the Wiswesser Line Notation [3] and the SMILES [4], are examples for standardized conventions for labeling molecules (see Section 12.8). In addition, these representations do not include information on the 3D conformation.
The systemic naming conventions are based on chemical graphs, which represent atoms as vertices and bonds as edges, defining the exact connectivity within the molecule. For example, IUPAC recommended names, such as 2-butanol, number attachment points based on graph theory. In combination with 3D coordinate information, many descriptors have been developed to capture particular features of the molecules and more complex systems, like reactions, crystal structures and protein-ligand complexes. For example, in reaction classification the difference in chemical graphs between reactants and products is used, and docking of ligands in the active site of proteins uses force fields to calculate binding energy, using a combination of 3D coordinates and the graph representation.
At the other end of the scale we find quantum chemical descriptors, which in detail represent the 3D molecular information. Here, atoms are represented by atomic orbitals centered on points in 3D space. The molecular bonding is represented by hybridization of atomic orbitals into molecular orbitals. The disadvantage of this method is the need to find a balance between accuracy and the required computing power. Approximations can be made to reduce the complexity of the calculations, leading to semi-empirical methods like MNDO and AM1. These methods are faster but less accurate at the same time.
Force fields provide even faster energy calculations based on 3D conformations. They use a representation of molecules where atomic coordinates are complemented by rules that approximate the energy of the system based on contributions from interactions between two, three and four atoms (bond, angle and torsion interactions). The contributions are based on physical laws where the parameters are derived from experimentally determined molecular properties. While not as accurate as quantum chemistry, it is much faster and allows to analyze much larger systems, like protein structures, crystal structures and dynamical chemical processes. The accuracy strongly depends on the parametrization of the rules that approximate the interactions. Force fields have the disadvantage that this \topic{parametrization} has to be repeated for each new class of molecules and type of molecular system.
The next two sections discuss applications of graph-based representations in data analyses and in property databases, and give more details on the use of quantum chemistry as representation. The sections following these discuss the need and use of numerical representations.
Chemical Graphs
Graph-based representations are popular because they represent chemical structures in a rather intuitive way, although simplistic: molecules are atoms held together by bonds, and certain atom groups (functional groups) give rise to certain molecular properties. For example, an acid group reduces the pKa of the molecule and makes the molecule react with an amine. Searching a functional group in a molecule corresponds to finding a subgraph in the chemical graph [5,6], when the molecule is considered a graph where atoms are vertices and bond edges.
The chemical graph also allows the use of canonization methods, such as the Morgan algorithm [7]. Using these methods, line notations can be developed which are unique for a molecule, making the look-up of molecular structures in databases much easier. The Wiswesser Line Notation is one of such notations, but nowadays the SMILES line notation is most used. However, the canonization algorithm used to generate canonical SMILES has never been published and cannot generally be used as unique molecular identifier.

Figure 3.2: 2D diagrams of the two possible resonance structures of a compound with a phenyl ring. Both diagrams refer to the same compounds, but the depicted graph representations are not identical.
The use of these line notations and the substructure searching has allowed setting up databases with molecular structures and their properties. For example, the PDB database contains crystal structures of proteins, nucleic acids and their complexes with ligands [8]. Other databases contain physical properties [9], 13C and 1H NMR [10], and IR spectra [11]. The Chemical Abstracts Service (CAS) maintains a substance database with millions of chemical substances extracted from literature. In 2008 this number increased by about 4000 entries each year. However, only for a fraction of these compounds more information is available in other curated databases. For example, the Cambridge Structural Database (CSD) had 400 thousand registered compounds (~1.3%) with associated crystal structures in 2008, and that number increases by only 30 thousand structures each year [12]. Moreover, the increase in information in literature is estimated at even 1~million new compounds per year from more than 700 thousand articles in chemistry-related literature [13]. In addition to these proprietary databases, open-access databases have emerged, such as PubChem [14] and ZINC [15].
These chemical graph-based databases have found many applications, such as systems for synthesis planning, where reactions are represented as changes in the molecular graph when going from reactant to the product side [16]. An example of such a tool is the Organic Chemical Simulation of Syntheses (OCSS) [17], which mimics the process of retro-synthetic synthesis planning. This has led to a number of computer-assisted synthesis design (CASD) systems, such as the LHASA system, noteworthy because it used a large knowledge base extracted from literature [18].
Another important application of chemical graphs is the use in structure generation, which fulfills a crucial role in computer-aided structure elucidation (CASE). DENDRAL is an example CASE system that elucidated molecular structures using mass spectra [19]. It derived graph constraints from the input spectrum and the molecular formula, and then generated possible structures, each of which was evaluated by comparing a predicted spectrum with the experimental one. The best spectral match was proposed as elucidated structure. The same approach is used for NMR-based CASE, where, in addition to the structure generation, graph theory is used to describe molecular fragments using alphanumeric codes, of which the HOSE code [20] is still widely used. Correlation of these codes with chemical shifts provides a cheap but effective method for predicting NMR spectra.
However, while the application of graph theory in chemistry has shown to be quite powerful, it is unable to reflect to full chemistry that can be found in molecules. Consider the benzene derivative diagrams shown in Figure 3.2. The two diagrams show non-identical graphs, but refer to the same molecular compound; the only difference is that of the resonance structures of the phenylic ring.
Organometallic compounds are excellent examples of another class of molecules that are difficult to represent using chemical graphs: they involve complex delocalized bonding systems. Ferrocene, shown in Figure 3.3, is an organometallic compound where two cyclopentadienyl fragments are bound to the iron. No classical two electron bonds can be drawn between the iron and any of the carbons; instead, the two six-electron π-systems of the cyclopentadienyl rings that bind to the iron. In the nineties several alternative approaches have been suggested to address this problem [21,22,23].
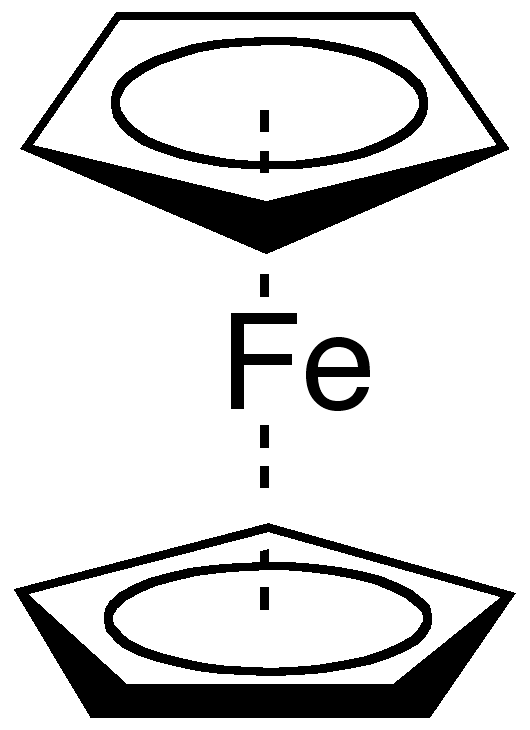
Figure 3.3: 2D diagram of ferrocene, which, like all organometallic compounds, is difficult to represent with classical chemoinformatics approaches.
Quantum Chemistry
Quantum mechanics offers an alternative to chemical graphs as representation of molecular species. Early in the 20th century it was discovered that it can accurately describe chemical and physical properties of molecules.
Quantum chemistry takes advantage of the knowledge that electrons are not randomly <!– quantum chemistry distributed around the nuclei to which they are bound. Instead, their motion can be accurately described by a wave model, due to the fact that any particle both behaves as particle as well as a wave function. Now, molecular properties, or any chemical or physical property in general, can be calculated by solving the Schrödinger equation.
This leads to the exact electronic structure of the matter under study, from which any property can be calculated in arbitrary accuracy. After development of this theoretical method it was even claimed everything in chemistry was now understood; Dirac wrote [24]:
-
The underlying physical laws necessary for the mathematical theory of a large part
of physics and the whole of chemistry are thus completely known, and the difficulty
is only that the exact application of these laws leads to equations much too
complicated to be soluble.
Indeed, since the quantum mechanical description of matter is a function of all
electrons and all nuclei and their interactions, the complexity scales
rather unfortunately with the number of atoms N. Several approximations can be
made to reduce the mathematical complexity, but the calculations still
scale as N^4, or even N^8 for more precise calculations [25].
This means that the calculation for a molecule
twice as large as ethanol, takes 16 up to 256 times as long. A small biochemically
relevant molecule, e.g. nonane-4,6-dione, with only three times as many atoms, takes
81 up to 6561 times as long. Nevertheless, properties of even more complex molecules can
now be calculated within hours or days. However, for current practices, like virtual screening,
this is practically infinitely long. When going beyond small molecules, such as
reaction mechanisms, and protein binding, the calculations become impossible.
Because neither chemical graph and quantum chemistry are practically useful for the much-needed prediction of physical, chemical and biological properties, many other representations of molecules and molecular systems have been developed. The following section discusses a class of numerical representations, which are often based on graph or quantum chemical representations, but focused to capturing molecular information relevant to the data analyzed or modeled.
Numerical Representations
One major problem is common to chemical graph and quantum chemistry representations when it comes to data analysis: their length depends on the size of the molecular system. Most statistical modeling methods, like partial least squares (PLS) [26,27] and principal component analysis (PCA), require a fixed length representation independent of the size of the molecular system. Moreover, these methods expect that variables have the same meaning for all molecules. Additionally, many methods require the representation to be numerical, such as PLS; notable exceptions are the decision tree and random forest methods.
Many numerical representations for molecules, called molecular descriptors, have been developed [28]; examples includes descriptors which include quantum chemical features, such as the highest-occupied-molecular-orbital descriptor, or chemical graph features, such as the fingerprint descriptor. Both of them have a fixed length and are numeric. Several programs are now available that can calculate these molecular descriptors, including Dragon, JOELib [29] and the CDK [30,31].
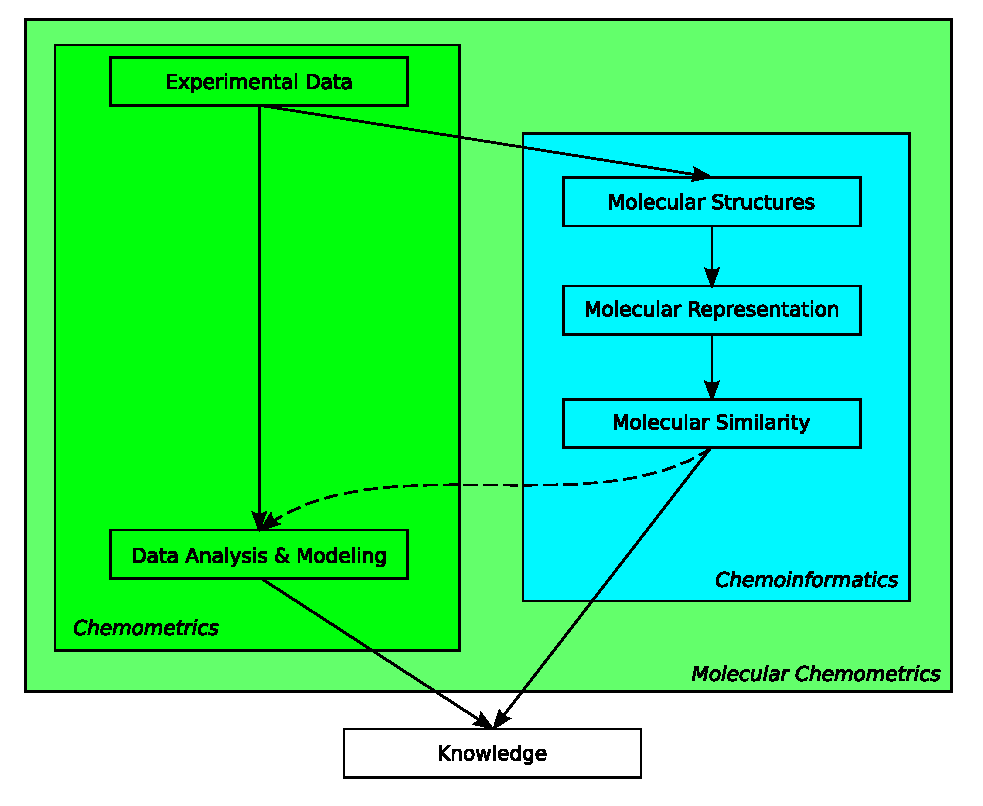
Figure 3.4: While both fields aim at increasing our knowledge about chemistry, chemometrics has traditionally focused on extracting information from analytical data (darker green area), where chemoinformatics focused on structural information of molecules (blue-ish area). Molecular chemometrics (light green area) takes approaches from both to study properties of molecules and molecular systems.
Chemometrics
The use of these uniform-length representations has the advantage that the broad range of multivariate, statistical methods used in chemometrics can be applied. Chemometrics is traditionally described as the application of mathematical and statistical methods to chemical measurements. [32]. Typical topics in chemometrics, therefore, are (multivariate) calibration, signal processing, experimental designs, statistics, and pattern recognition [33]. Data mining and modeling of analytical data has led to a rich field, where mathematical and statistical methods are used to analyze the chemical data. The nature of the analytical data, however, such as the high collinearity in NIR and IR spectra, has led to extensive study of multivariate regression and classification methods. These chemometrical methods turn out to have great value when used with numerical representations of molecular systems.
While chemometrics focuses on the statistical analysis of mostly multivariate chemical data, chemoinformatics generally uses the chemical graph as principal representation of molecular data. The previous section has shown that both complement each other when dealing with the understanding and prediction of properties of molecular systems (see Figure 3.4). Bridging the gap between representation of molecular structures or systems composed of molecular structures, and statistical and data mining methods, has shown to be an interesting area of research [34,35,36].
A growing number of studies, however, use methodologies from both fields to study relationships between molecular and intermolecular information and properties of those systems. This book focuses on how the Chemistry Development Kit supports this multidisciplenaire research.
References
- Willighagen E. Representation of Molecules and Molecular Systems in Data Analysis and Modeling [Internet]. 2008. Available from: http://repository.ubn.ru.nl/handle/2066/72267
- Wiener H. Correlation of Heats of Isomerization, and Differences in Heats of Vaporization of Isomers, Among the Paraffin Hydrocarbons. J Am Chem Soc. 1947 Nov;69(11):2636–8. doi:10.1021/JA01203A022 (Scholia)
- Wiswesser WJ. How the WLN began in 1949 and how it might be in 1999. JCICS. 1982 May 1;22(2):88–93. doi:10.1021/CI00034A005 (Scholia)
- Weininger D. SMILES, a chemical language and information system. 1. Introduction to methodology and encoding rules. JCICS [Internet]. 1988 Feb 1;28(1):31–6. Available from: http://organica1.org/seminario/weininger88.pdf doi:10.1021/CI00057A005 (Scholia)
- LC R, RA K. Finding Chemical Records by Digital Computers. Science. 1957 Oct 1;126(3278):814–9. doi:10.1126/SCIENCE.126.3278.814 (Scholia)
- Ullmann JR. An Algorithm for Subgraph Isomorphism. J ACM. 1976 Jan 1;23(1):31–42. doi:10.1145/321921.321925 (Scholia)
- Morgan HL. The Generation of a Unique Machine Description for Chemical Structures-A Technique Developed at Chemical Abstracts Service. Journal of chemical documentation. 1965 May;5(2):107–13. doi:10.1021/C160017A018 (Scholia)
- Berman HM, Henrick K, Nakamura H. Announcing the worldwide Protein Data Bank. Nature structural biology. 2003 Dec;10(12):980. doi:10.1038/NSB1203-980 (Scholia)
- Linstrom JL, Mallard WG. NIST Chemistry WebBook; NIST Standard Reference Database No. 69, Gaithersburg MD, 2001
- Steinbeck C, Kuhn S. NMRShiftDB – compound identification and structure elucidation support through a free community-built web database. Phytochemistry. 2004 Oct;65(19):2711–7. doi:10.1016/J.PHYTOCHEM.2004.08.027 (Scholia)
- YAMAMOTO O, SOMENO K, WASADA N, HIRAISHI J, HAYAMIZU K, TANABE K, et al. An integrated spectral data base system including IR, MS, 1H-NMR, 13C-NMR, ESR and Raman spectra. Analytical Sciences. 1988;4(3):233–9. doi:10.2116/ANALSCI.4.233 (Scholia)
- Allen FH, FH A. The Cambridge Structural Database: a quarter of a million crystal structures and rising. Acta Crystallographica Section B. 2002 May 29;58(3):380–8. doi:10.1107/S0108768102003890 (Scholia)
- Engel T. Basic overview of chemoinformatics. JCIM. 2006 Nov 1;46(6):2267–77. doi:10.1021/CI600234Z (Scholia)
- Austin CP, Brady LS, Insel TR, Collins F. NIH Molecular Libraries Initiative. Science. 2004 Nov 1;306(5699):1138–9. doi:10.1126/SCIENCE.1105511 (Scholia)
- Irwin JJ, Shoichet BK. ZINC–a free database of commercially available compounds for virtual screening. JCIM. 2005 Jan 1;45(1):177–82. doi:10.1021/CI049714 (Scholia)
- Blair J, Gasteiger J, Gillespie C, Gillespie PD, Ugi I. Representation of the constitutional and stereochemical features of chemical systems in the computer assisted design of syntheses. Tetrahedron. 1974 Jan;30(13):1845–59. doi:10.1016/S0040-4020(01)97318-1 (Scholia)
- EJ C, WT W. Computer-assisted design of complex organic syntheses. Science. 1969 Oct 1;166(3902):178–92. doi:10.1126/SCIENCE.166.3902.178 (Scholia)
- Corey EJ, Wipke WT, Cramer RD, Howe WJ. Computer-assisted synthetic analysis. Facile man-machine communication of chemical structure by interactive computer graphics. J Am Chem Soc. 1972 Jan;94(2):421–30. doi:10.1021/JA00757A020 (Scholia)
- Lederberg J. How DENDRAL was conceived and born. 1987;5–19. doi:10.1145/41526.41528 (Scholia)
- Bremser W. HOSE — a novel substructure code. Anal Chim Acta. 1978 Dec;103(4):355–65. doi:10.1016/S0003-2670(01)83100-7 (Scholia)
- Dietz A. Yet Another Representation of Molecular Structure. JCICS. 1995 Sep 1;35(5):787–802. doi:10.1021/CI00027A001 (Scholia)
- Konstantinova EV, Skorobogatov VA. Molecular Hypergraphs: The New Representation of Nonclassical Molecular Structures with Polycentric Delocalized Bonds. JCICS. 1995 May 1;35(3):472–8. doi:10.1021/CI00025A015 (Scholia)
- Gasteiger J, Bauerschmidt S. Overcoming the Limitations of a Connection Table Description: A Universal Representation of Chemical Species. JCICS. 1997 Jul;37(4):705–14. doi:10.1021/CI9704423 (Scholia)
- Dirac PAM. Quantum Mechanics of Many-Electron Systems. Proc R Soc A. 1929 Apr 6;123(792):714–33. doi:10.1098/RSPA.1929.0094 (Scholia)
- Goodman JM. Chemical Applications of Molecular Modeling. Burlington House, United Kingdom: Royal Society of Chemistry; 2002.
- Geladi P, Kowalski BR. Partial least-squares regression: a tutorial. Anal Chim Acta. 1986;185:1–17. doi:10.1016/0003-2670(86)80028-9 (Scholia)
- de Jong S. SIMPLS: An alternative approach to partial least squares regression. Chemometr Intell Lab. 1993 Mar;18(3):251–63. doi:10.1016/0169-7439(93)85002-X (Scholia)
- Todeschini R, Consonni V. Handbook of Molecular Descriptors. Hoboken, USA: Wiley-Blackwell; 2000. doi:10.1002/9783527613106 (Scholia)
- J. K. Wegner, PhD thesis, Eberhard-Karls-Universität Tübingen, Tübingen, Germany, 2006
- Steinbeck C, Han Y, Kuhn S, Horlacher O, Luttmann E, Willighagen E. The Chemistry Development Kit (CDK): an open-source Java library for Chemo- and Bioinformatics. JCICS. 2003 Feb 11;43(2):493–500. doi:10.1021/CI025584Y (Scholia)
- Steinbeck C, Hoppe C, Kuhn S, Floris M, Guha R, Willighagen E. Recent Developments of the Chemistry Development Kit (CDK) - An Open-Source Java Library for Chemo- and Bioinformatics. Curr Pharm Des [Internet]. 2006 Jun 1;12(17):2111–20. Available from: https://cdk.github.io/cdk-paper-2/ doi:10.2174/138161206777585274 (Scholia)
- Kowalski BR. Chemometrics. Anal Chem. 1980 Apr;52(5):112–22. doi:10.1021/AC50055A016 (Scholia)
- BK L. Chemometrics. Anal Chem. 2000 Jun 1;72(12):91R-97R. doi:10.1021/A1000016X (Scholia)
- Buydens LMC, Reijmers TH, Beckers MLM, Wehrens R. Molecular data-mining: a challenge for chemometrics. Chemometr Intell Lab. 1999 Oct;49(2):121–33. doi:10.1016/S0169-7439(99)00039-8 (Scholia)
- Wehrens R, Gelder R de, Kemperman GJ, Zwanenburg B, Buydens LMC. Molecular challenges in modern chemometrics. Anal Chim Acta. 1999 Nov;400(1–3):413–24. doi:10.1016/S0003-2670(99)00621-2 (Scholia)
- Willighagen E, Wehrens R, Buydens L. Molecular Chemometrics. Crit Rev Anal Chem. 2006 Dec;36(3–4):189–98. doi:10.1080/10408340600969601 (Scholia)